Learning to chart
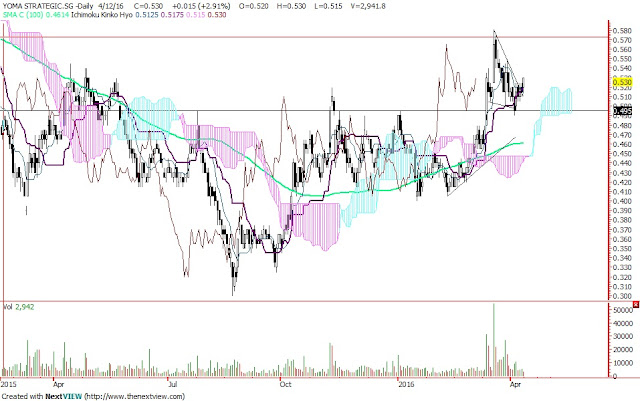
I strated charting long time ago. I run to book stall to look for books. Most are very expensive, thus I change to visit the library. This are my view for chart which I also call him as price graph.
There is lots of confusion in learning chart.
1) Too many methods, which is the one for me?
2) It seems that it works at time and dont work the other time.
3) It looks so different when the price is moving, and so clear and simple when its over.
So how should one learn charting?
First, you must understand that chart is just a collection of data. Its just like profit and lost data, sales data etc. But its being put into a graph to show you visually instead of all the numbers.
Second, all methods are just a form of probability. The chances that the share will continue for varies reason.
If you are in a company, you have sales graph of many products for procurement. How are you going choose which products to buy?
We might want to use graph to see the track records of the products. Than we use the method we understand to buy into the product we selected.
We keep testing the method we use, modified it to produce the result we want.

Comments
Post a Comment